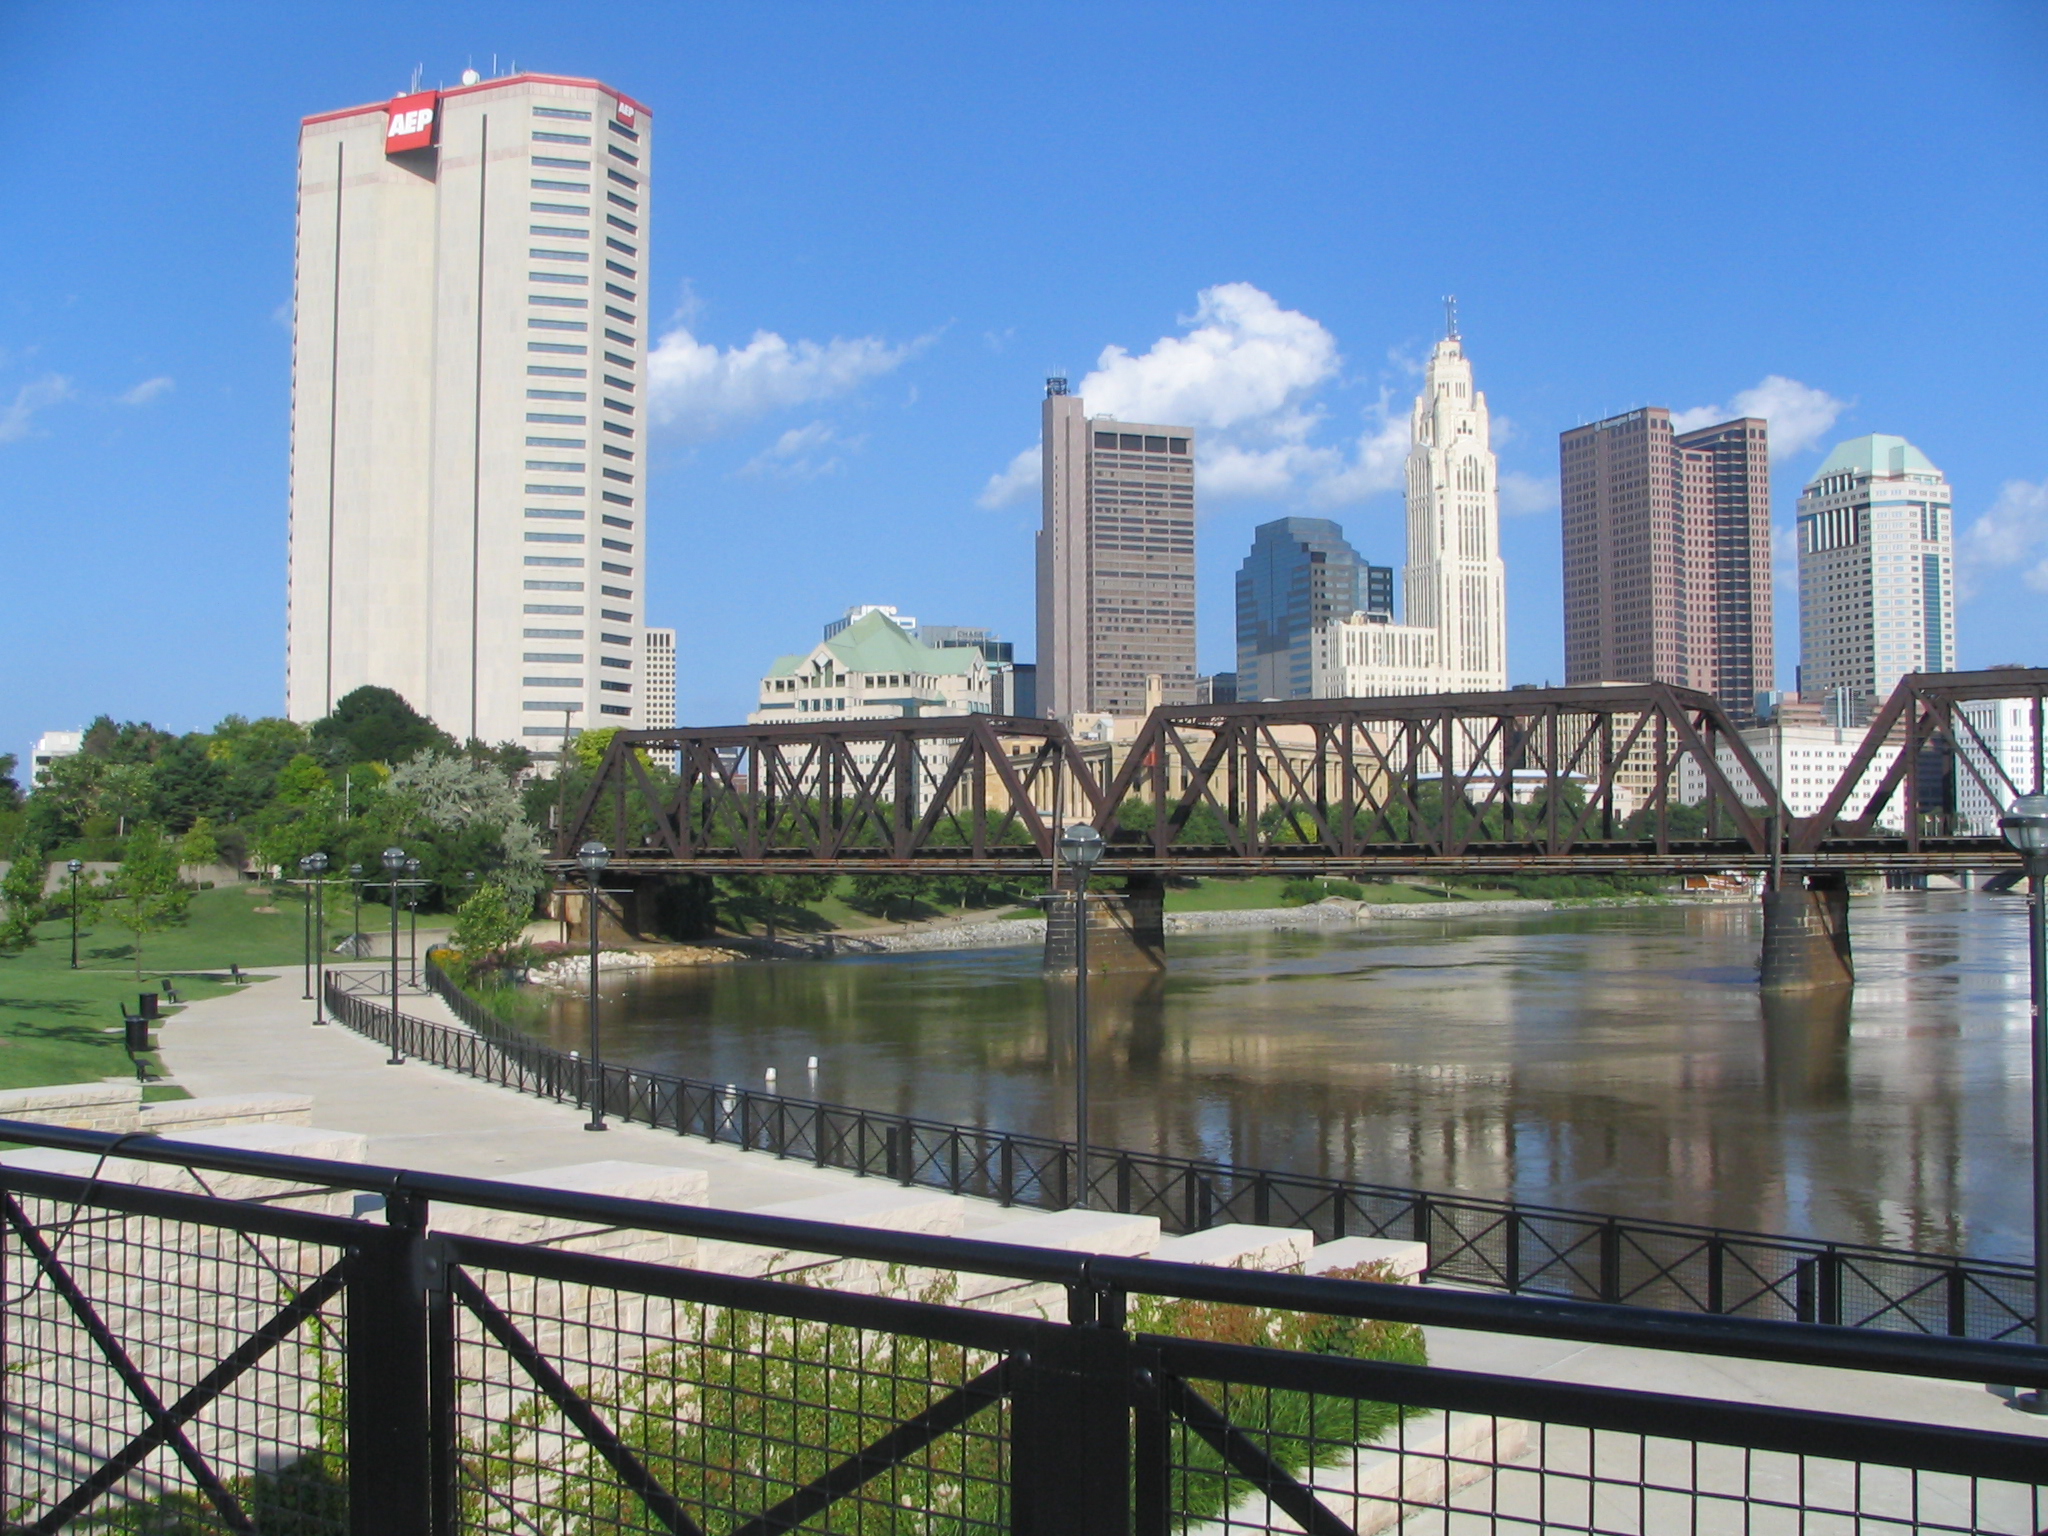
Metro park
Scioto Audubon Metro Park
119-acre riverfront park just south of downtown Columbus with boating, paddling, fishing and the Scioto Greenway Trail.
Visit the official Scioto Audubon Metro Park resourcePickaway County, Ohio · USGS 03230700
Latest observation
What this gauge represents: This gauge measures conditions on Scioto River at its USGS monitoring location in Pickaway County; conditions elsewhere on the waterway may differ.
How much water moves past the gauge each second. Higher numbers mean more water is moving downstream.
The water-surface height at this gauge. It is useful for tracking rises, falls and flood thresholds, but it is not the river's total depth.
How much the latest reading has risen or fallen compared with roughly 24 hours earlier.
The typical streamflow for this date based on USGS historical statistics. A multiple such as 3× means current flow is about three times the historical median.
Get Water Data's plain-language summary of current flow, historical context and recent direction.
Official action and flood thresholds where available. These levels are specific to each gauge location.
Gauge height and flood stage are station-specific. A 12-foot reading at one gauge should not be directly compared with 12 feet at another.
Streamflow is currently 3,930 ft³/s, 6.7× the historical median for this date. Flow has fallen 1,530 CFS over the past 24 hours.
USGS-reported historical daily median for 09-27: 587 ft³/s · Based on USGS day-of-year statistics
How trends & context are calculated →Daily mean streamflow · Aug 28–Sep 25 · dates shown in UTC · 28 observations
Data gap: 1 calendar day is missing in this coverage. The line stops across missing observations.
| Date (UTC) | Daily mean |
|---|---|
| Aug 28, 2026, 12:00 AM | 1,990 CFS |
| Aug 29, 2026, 12:00 AM | 1,660 CFS |
| Aug 30, 2026, 12:00 AM | 1,450 CFS |
| Aug 31, 2026, 12:00 AM | 1,330 CFS |
| Sep 1, 2026, 12:00 AM | 1,220 CFS |
| Sep 2, 2026, 12:00 AM | 1,140 CFS |
| Sep 3, 2026, 12:00 AM | 1,100 CFS |
| Sep 4, 2026, 12:00 AM | 1,020 CFS |
| Sep 5, 2026, 12:00 AM | 2,140 CFS |
| Sep 6, 2026, 12:00 AM | 3,760 CFS |
| Sep 7, 2026, 12:00 AM | 4,810 CFS |
| Sep 8, 2026, 12:00 AM | 2,720 CFS |
| Sep 9, 2026, 12:00 AM | 2,170 CFS |
| Sep 10, 2026, 12:00 AM | 4,060 CFS |
| Sep 11, 2026, 12:00 AM | 3,440 CFS |
| Sep 12, 2026, 12:00 AM | 3,220 CFS |
| Sep 13, 2026, 12:00 AM | 7,230 CFS |
| Sep 14, 2026, 12:00 AM | 4,980 CFS |
| Sep 15, 2026, 12:00 AM | 3,240 CFS |
| Sep 16, 2026, 12:00 AM | 2,410 CFS |
| Sep 17, 2026, 12:00 AM | 2,020 CFS |
| Sep 19, 2026, 12:00 AM | 4,360 CFS |
| Sep 20, 2026, 12:00 AM | 9,290 CFS |
| Sep 21, 2026, 12:00 AM | 15,100 CFS |
| Sep 22, 2026, 12:00 AM | 17,100 CFS |
| Sep 23, 2026, 12:00 AM | 10,400 CFS |
| Sep 24, 2026, 12:00 AM | 8,420 CFS |
| Sep 25, 2026, 12:00 AM | 6,860 CFS |
Connect this monitoring-location reading with verified places and official visitor information. A gauge describes conditions only at its location; it is not itself a public access point.
Explore the Scioto River119-acre riverfront park just south of downtown Columbus with boating, paddling, fishing and the Scioto Greenway Trail.
Visit the official Scioto Audubon Metro Park resource620-acre park along a scenic bend of the Scioto with paddling access, river fishing, overlooks and more than seven miles of trails.
Visit the official Scioto Grove Metro Park resourcePublic launch on Griggs Reservoir with access for power boats and paddle craft.
Visit the official Trabue-Murphy Boat Launch resourceGet Water Data organizes provisional public monitoring data from the U.S. Geological Survey.
View USGS station →